For the Birds
The best time to plant a tree, according to the old adage, is 20 years ago. You could say the same for starting a research project. And what if you had begun more than 50 years ago? You would have accrued a remarkable trove of observational data, with value that only time can confer.
That’s what emeritus biology professor Richard Holmes has done. Every year since 1969, Holmes and his assistants have returned to the same 25-acre section of woods in the Hubbard Brook Experimental Forest near Woodstock, New Hampshire, to conduct a census of every bird species on the plot and create territorial maps for each breeding pair of birds they observed. “It’s extraordinary,” says Matt Ayres, professor of biological sciences. “Every species that’s nested on that territory over 50 years is on those maps. There’s no data like this anywhere in the world.”
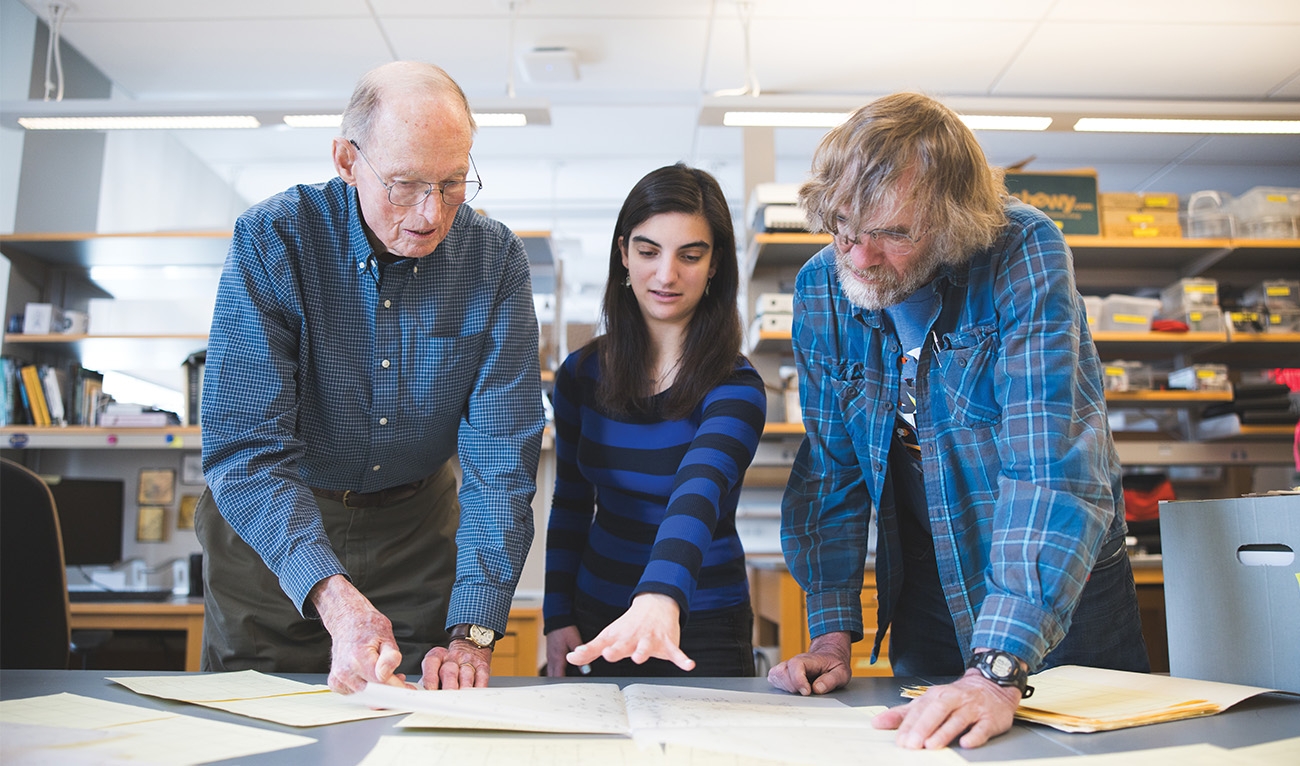
For decades the paper maps, which through the years Holmes and his many generations of coresearchers painstakingly created by hand, resided in a room at Hubbard Brook modestly dubbed the “Data Barn.” In June 2021 Miranda Zammarelli, Adv’26, then a newly arrived doctoral candidate in Ayres’ lab, met with Holmes and Ayres at Hubbard Brook to review the maps and kick around some ideas for a project. Zammarelli decided the first order of business would be to bring the maps into the 21st century: During a couple of weeks that December, she scanned the nearly 3,000 maps, creating high-resolution digital images.
As Zammarelli worked, she found details in the maps about the population and distribution of the species represented. “There’s one large map per species that are found on the plot per year. There would be a single territory mapped if there was just one pair of birds there or there might be 10 territories or 20 individual birds,” says Zammarelli. “As you’re going through, you notice the variations in the sizes of the territories. Handling those maps during the scanning, rather than just being handed the data, gave me a lot of time to ponder them and think about theories and questions I could ask.”

The maps themselves are masterpieces of fieldwork. To plot birds inhabiting each 200-by-500-meter grid, Holmes and his students walked through the wooded plot listening for bird calls. “You have to be very familiar with the calls and the songs of these guys, because most mapping is based on what you hear. You don’t see the birds that often,” explains Holmes.
“These are not random people,” Ayres says of Holmes and his research assistants. “They’re people with exceptional skills in field biology. The work they do with the birds, I could never do that, but I’m really good at carrying batteries.” (Ayres’ expertise is in the population ecology of forest insects.)
Male songbirds use calls to other males of the species to establish the boundaries of their territory. “It’s kind of a territorial rap battle,” says Zammarelli. If, for example, the researcher walking the plot hears two ovenbirds squawking at each other, they mark the spot on the map. Day after day, for about five weeks of the breeding season in spring, the accumulating dots on the maps slowly indicate the boundary lines of the breeding pairs for that year.
There are two reigning models for how species inhabit a given chunk of real estate: ideal free distribution (IFD) and ideal despotic distribution (IDD). In an IFD habitat, the birds will arrange themselves more or less equally, expanding or contracting territorial boundaries in a way that accommodates the full population of the species in that space. With IDD, dominant—or despotic—birds will take for themselves as much territory as they want or can defend, and the rest of the population will have to make do with smaller plots. Zammarelli realized she had in the treasure trove of maps just what was needed to discover which model best described the bird populations at Hubbard Brook.
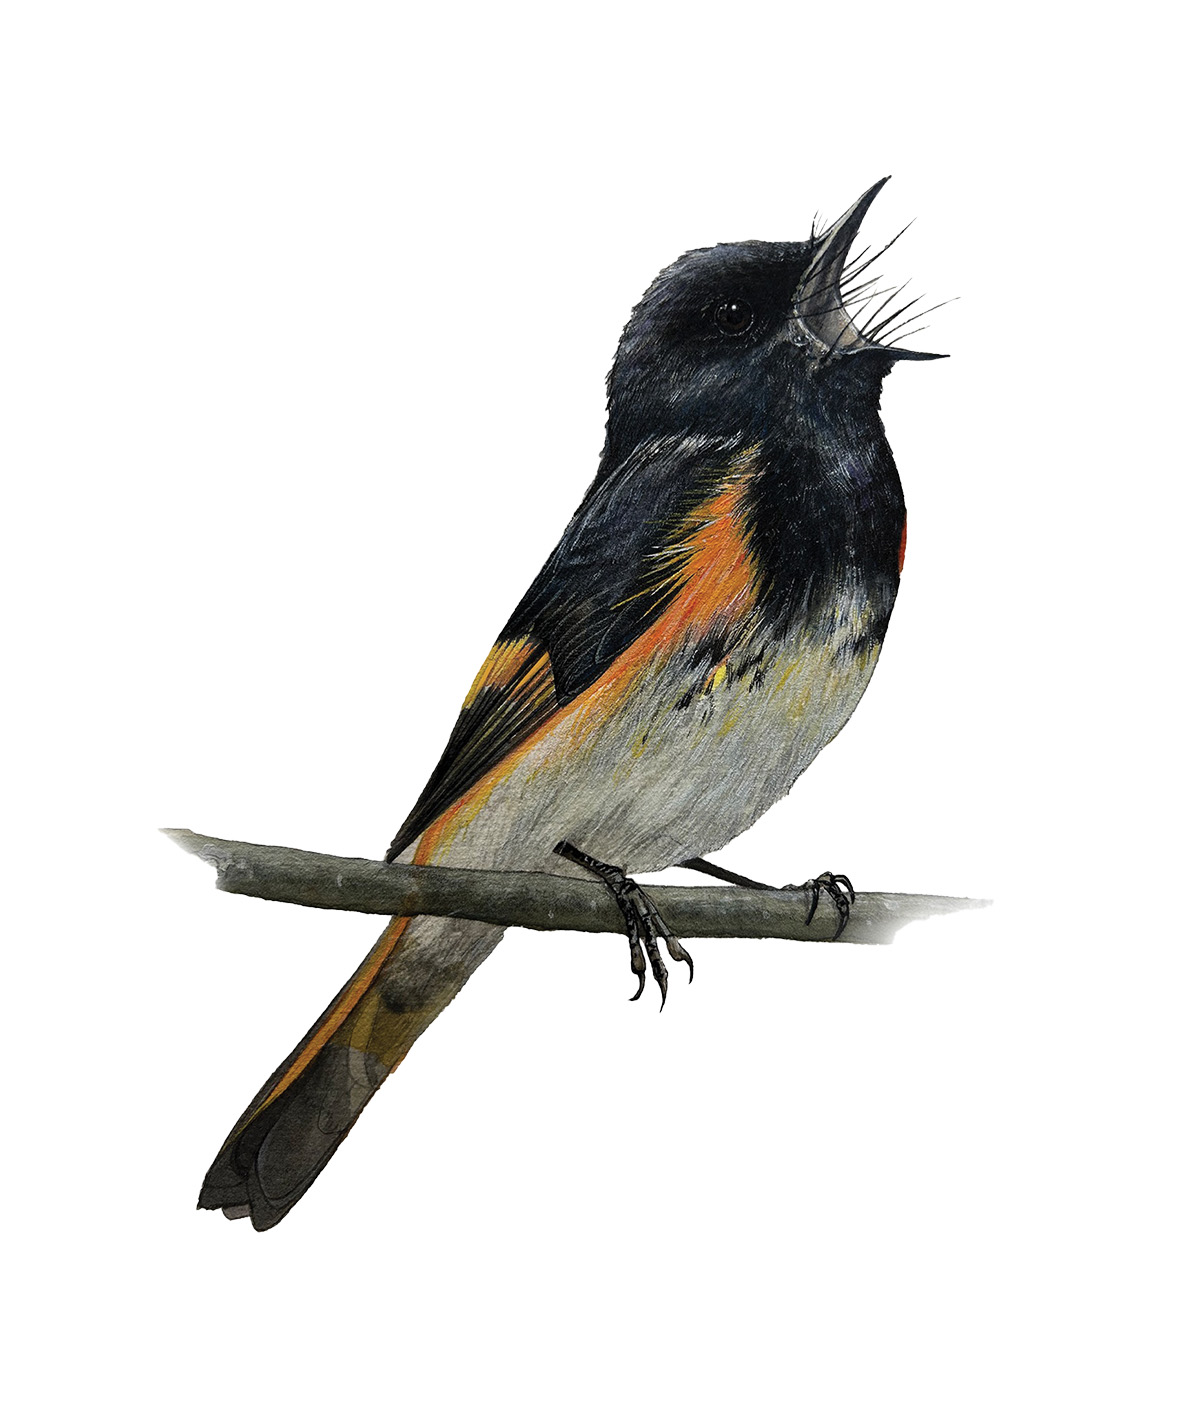
Zammarelli examined the territories of mating pairs for seven species common to the Hubbard Brook plot across many decades, including the red-eyed vireo and the American redstart, to see if territories contracted to accommodate larger populations of a species in a given year or if particular pairs captured disproportionally large territories, forcing others into smaller plots with fewer resources.
After a statistical analysis of the decades of data, Zammarelli determined the Hubbard Brook birds adhered to IFD behavior, with birds of the same species enjoying resources of the limited plot equally as the population swelled and waned each year. “It could have gone either way, and I think that’s what was exciting about this study,” she says. “It makes more sense to me, as it takes a lot of energy to constantly fight with your neighbor to defend your territory.”
She notes the data show the parts of the forest specific species have preferred, even as the environment has changed, which could help conservation organizations decide how and where to focus their efforts. Zammarelli is lead author—with coauthors Holmes, Ayres, Hannah ter Hofstede from the University of Windsor, and David Lutz, a visiting scholar in the environmental studies program—on a paper detailing the findings published in Ecology Letters.
The results, says Holmes, are significant, and almost certainly can be generalized to songbirds in forest habitats. “Miranda has been able to show pretty convincingly that IFD is the dominant mode of action over there,” he says. “This is good because it’s been quite controversial. We’d have one short-term study that would show one thing and another one that would show a different direction, so it wasn’t really clear what the general pattern was.”
Mario Cohn-Haft ’83, a research scientist at the National Institute for Amazonian Research (Instituto Nacional de Pesquisas da Amazônia) in Manaus, Brazil, was one of the generations of students who helped create the maps through the decades. He calls the maps a precious body of data. “These long-term studies are so rare and produce special results that we would not know any other way,” he says. “What Dick Holmes has produced is a real testament to his legacy.”
For Zammarelli, the study has exposed the new directions for her research. “One thing that stood out is just how variable territory size really is,” she says. “I wasn’t expecting such a difference across years or species. Why such big variations? That’s the next question I’m thinking about, and it’s really exciting.”
“I expect that this will be a paper that people will be citing decades from now,” says Ayres. “Because even if people start right now, it’s going be years before they can have this kind of data.”
Chris Quirk is a frequent contributor to DAM. He wrote about professor Andrew Campbell’s research using smartphones to detect depression in the May/June issue.